How to Explain ARC New York City REIT Performance?
June 12, 2018 | James Sprow | BlueVault

American Realty Capital New York City REIT closed its IPO on May 31, 2015, after raising approximately $750 million including proceeds from distribution reinvestments. In the offering, shares were priced at $25.00. On October 24, 2016, the REIT published its first estimated NAV per share at $21.25, as of June 30, 2016. On October 25, 2017, the REIT updated its estimated NAV per share to $20.25, with an as-of date of June 30, 2017. While it is understandable that a nontraded REIT with a relatively small and undiversified portfolio of properties, all concentrated in Manhattan, New York, might have an estimated NAV per share below its initial offering price due to the loads and expenses related to its IPO, what may be more difficult to understand is why that estimated NAV has not increased from 2016 to 2017.
In an investor presentation posted on the SEC website on June 5, 2018, the REIT’s advisors show the positive market trends for New York City real estate. Employment and population in the NYC metro are steadily rising, overall vacancy rates for Manhattan offices are declining, while net absorption is rising and asking rents have climbed significantly during the life of the REIT.
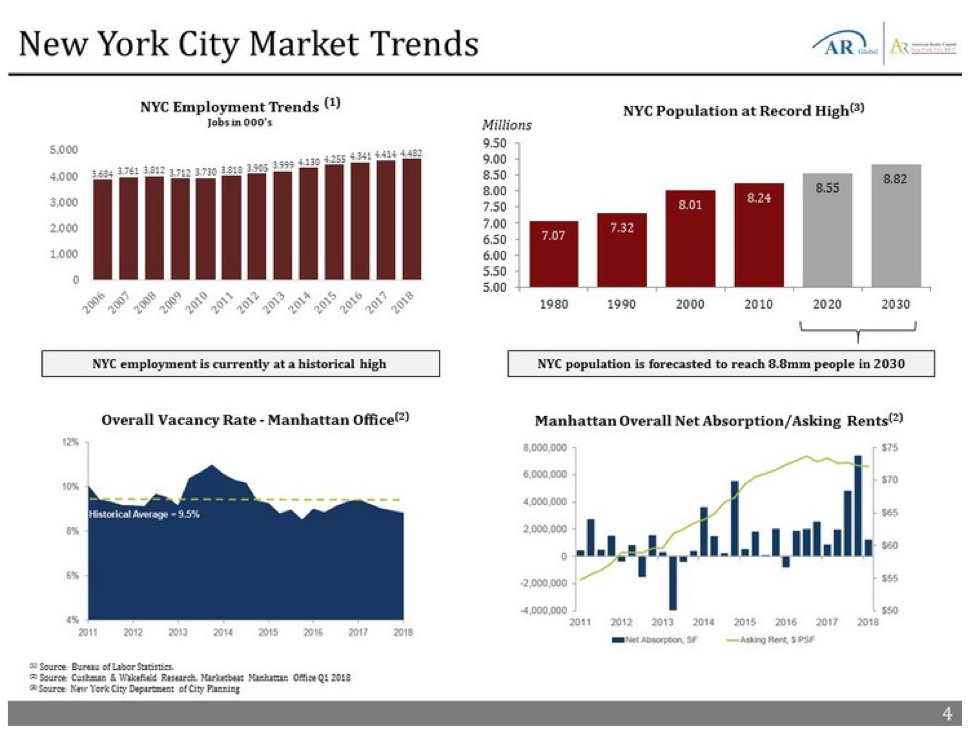
Given the somewhat rosy scenario depicted in the investor presentation, it would seem that the REIT’s office portfolio would be well-positioned to deliver positive results.
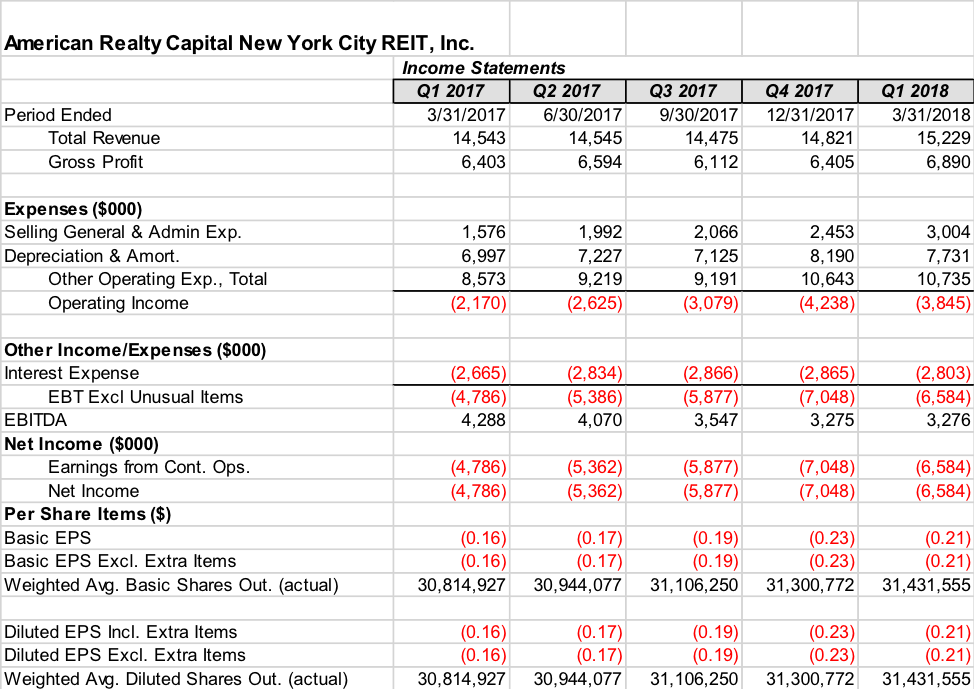
Looking at the financial statements for American Realty Capital New York City REIT, Inc., for the past five quarters, we don’t see the trends in earnings we might expect. While total revenues have increased 4.7% since Q1 2017, and gross profit has increased 7.6% over that time period, operating income, EBITDA and basic EPS have not improved. Operating income fell from a loss of $2.17 million in Q1 2017 to a loss of $3.85 million in Q1 2018. EBITDA fell from $4.29 million in Q1 2017 to $3.28 million in Q1 2018. And basic EPS fell from negative $0.16 per share in Q1 2017 to negative $$0.21 per share in Q1 2018.
Are there simple explanations for why the REIT’s NAV per share and income metrics have deteriorated in a seemingly positive economic environment?
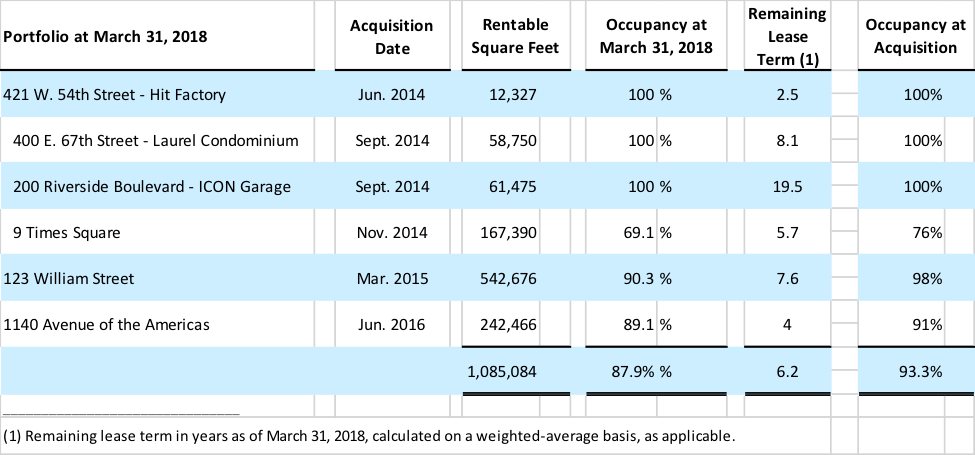
Looking at the REIT’s property portfolio which has been relatively stable over the last five quarters, it’s revealing that occupancies at the REIT’s three largest properties have actually fallen since they were acquired. The weighted average occupancy of the REIT’s portfolio is down from 93.3% when the properties were acquired to 87.9% at the end of Q1 2018. That’s a significant drop and must partially explain why the REIT’s financial performance has been disappointing.
However, a question that remains to be answered is why the REIT’s selling, general & administrative expenses have soared from $1.58 million in Q1 2017 to $3.00 million in Q1 2018. Blue Vault would expect, with a stable property portfolio and modest increases in rental revenues, that the REIT would have more stable expenses. That has not been the case, and may explain the drop in operating income, EBITDA and earnings per share.
The drop in estimated net asset value per share must certainly be the result of the REIT’s inability to boost occupancies and rents at their three largest properties. In a positive economic environment for office space in Manhattan, shareholders should expect better results.
If the REIT can sign new leases to increase the occupancies and revenues from their three largest properties, it might result in an increased estimated NAV as of June 30, 2018, when it is announced in October, 2018. Until then, it remains a mystery why selling, general & administrative expenses have climbed 91% from Q1 2017 to Q1 2018.
Sources: SEC; Q1 2018 Investor Presentation filed 6-5-2018; SPGlobal.com; Blue Vault

Learn more about AR Global on the Blue Vault Sponsor Focus page

American Finance Trust Reports Results of Self Tender Offer
American Finance Trust Offers Self Tender in Defensive Move